Goal
As the open-source Mojaloop software makes progress towards building a financially inclusive platform, there is a need to build a robust monitoring infrastructure that allows the operators to gain visibility into the software’s reliability. “Monitoring the Mojaloop” therefore focuses on monitoring the underlying infrastructure as well as the Mojaloop software itself. The following are the key goals
- Enable insights and reports around the performance of Mojaloop infra and software
- Enable access to application logs for debugging issues and software bugs
- Alert operators and maintainers when an unexpected event takes place
- Enable separation of concerns (monitoring backend should be loosely coupled with resources to be monitored)
The Author Muzammil Bashir is a senior software engineer with over a decade of experience. He specializes in developing scalable observability systems and is dedicated to building software that is both maintainable and secure. Muzammil actively contributes to open-source projects like Mojaloop, leveraging his expertise to foster community-driven innovation.
Overview
Which tools are we using to achieve the goal?
To achieve the above-mentioned goals, the community decided to use open-source tools. Prometheus is widely used in the industry to gather operational metrics. However, Prometheus needs to be coupled with a visualization tool such as Grafana to convert raw metric data into insightful charts and dashboards. To keep track of logs, we settled on using Loki. Loki is “like Prometheus, but for logs”. Additionally, it is designed and developed by Grafana Labs. Finally, alerting is achieved using Alertmanager. The system comprising Prometheus, Grafana, Loki and Alertmanager enables us to gain insights related to system performance and provides valuable data for debugging complex issues.
High-level architecture
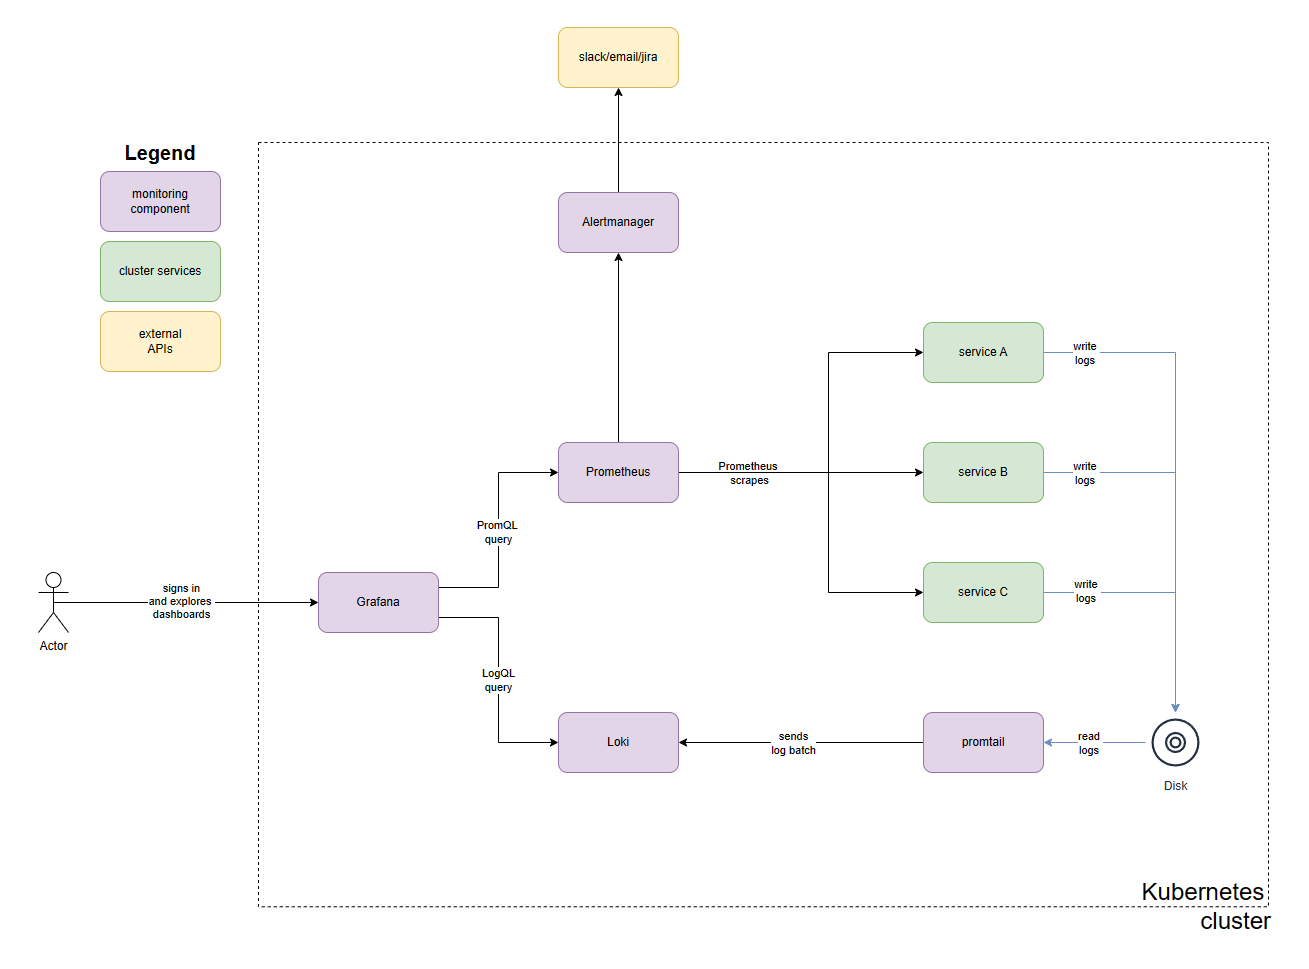
The main idea is that Prometheus is responsible for gathering metric data from applications. Prometheus then stores the data in TSDB (Time Series DataBase) and builds indexes for efficient retrieval. Prometheus and Alertmanager work in tandem to raise alerts related to unexpected behaviour in the cluster. Alert Manager has the ability to send alert notifications to Slack, email or Jira. These notifications play a crucial role in communicating the feedback to the team maintaining the software.
At the same time, Loki is responsible for storing and retrieving the application log data. Promtail (a Loki client) is responsible for gathering the logs before sending them over to Loki for storage and indexing. Finally, Grafana serves as the visualization tool that allows showing the raw data in the form of compelling dashboards. It also enables querying the relevant application log data for exploring system behaviour. It also enables authentication and authorization controls to manage access to monitoring data.
Our journey
Since the Mojaloop as a whole seems to be moving towards a Kuberntes based infrastructure, it made sense to invest in a kubernetes centric tooling and deployment approach (such as helm charts). We initially started with the simplest helm chart loki-stack officially maintained by Grafana Labs. This chart was able to deploy Grafana, Loki and Prometheus but it did not help with keeping the concerns separate. Following is the list of issues we faced with loki-stack:
- We needed to make a lot of changes to Prometheus and Loki configurations even to get a demo up and running
- Resources (such as dashboards, alerts etc.) needed to be hardcoded in the config file. This made it hard to dynamically add or remove relevant resources based on what services/modules are currently running in the cluster.
- Adding new scrape targets to Prometheus needed to be hardcoded. It was not working well with our “separation of concerns” goal.
- Versions of the individual components were not recent so using the loki-stack chart out of the box meant using quite old versions of Grafana/Prometheus/Loki.
To solve the above challenges, we looked for potential solutions. The following table gives an overview of our solution constraints:
| Problem | Solution Constraint |
|---|---|
| We needed to make a lot of changes to Prometheus and loki configurations even to get a demo up and running | Use a helm chart which is more actively maintained |
| Resources (such as dashboards, alerts etc.) needed to be hardcoded in the config file. | Use Grafana operator and custom resources |
| Adding new scrape targets to Prometheus needed to be hardcoded | Use Prometheus service monitor and operator |
As we looked for a possible alternative chart (other than Loki-stack), we stumbled upon Bitnami-maintained charts. We were already using Bitnami for multiple other services in our cluster and it requires minimal configuration to get things up and running. In addition to that, it exposes a wide array of generic controls to customize the installation using standard configuration. Bitnami charts supported deployment of Prometheus, Loki and Grafana using Kubernetes operators and custom resources. Therefore, Bitnami charts were well aligned with our solution constraints. Using Kubernetes operators to manage the monitoring stack also has the additional advantage of automatically updating configurations and notifying the corresponding services (Prometheus, Grafana, and Loki) without any downtime. It is also worth mentioning that using Bitnami charts for services such as MySQL, MongoDB, Kafka etc. saved us tens of hours of engineering time for setting up exporters and configuring them to be scraped by Prometheus. Bitnami did most of the heavy lifting out of the box.
Separation of Concerns Goal
When it comes to monitoring, the community had two concerns:
- Maintaining the core infrastructure
- Service Integration
The first concern (maintaining the core infrastructure) primarily deals with keeping the monitoring services (Prometheus, Loki) up and running. It also takes care of the underlying storage for monitoring data and configures the monitoring services. The second concern deals with the integration of the services being monitored by the monitoring system. Each concern is owned by a separate team. It is worth noting that by keeping these two concerns separate, we aim to achieve significant productivity gains for both teams. The team which owns the first concern can focus on improving the reliability and scalability of the overall monitoring system. Furthermore, they can work on adding new features to the monitoring system without being distracted by the requests from the development team to integrate new services to the monitoring system.
This separation of concern has been achieved by using Kubernetes operators and custom resources. As discussed earlier, we used the Prometheus operator and Grafana operator. Prometheus operator has the ability to process custom resources of type ServiceMonitor.In order to register new services with Prometheus, we need to add or update corresponding service monitor definitions. This custom resource is picked up by the Prometheus operator and it dynamically updates Prometheus configuration to scrape metric data from newly registered services. Similarly in order to add new Grafana dashboards, we leverage Grafana operator and GrafanaDashboard custom resources.
Note that these custom resources (of type ServiceMonitor and GrafanaDashboard) are not part of core monitoring infrastructure.In fact, the definitions of Mojaloop specific custom resources sit under the Mojaloop namespace as opposed to monitoring namespace in both git as well as kubernetes cluster. This enables the Mojaloop development team to own the service integration independent of core monitoring infrastructure.

Maintaining Grafana dashboards
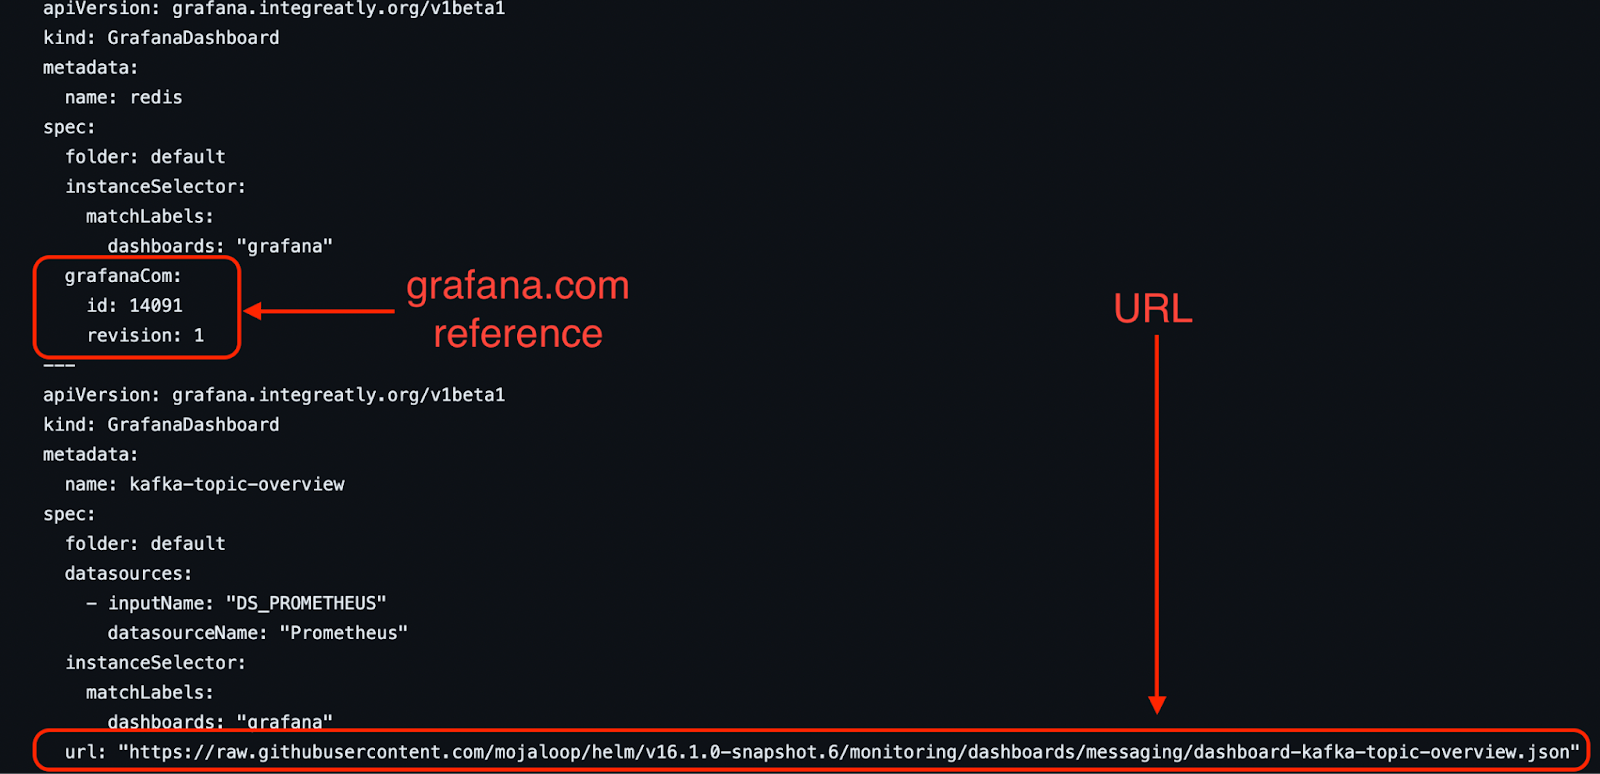
Monitoring the Mojaloop software means that we have to build and maintain a few custom dashboards to review the performance of core Mojaloop services. Since the Mojaloop software uses a lot of open-source 3rd party software components as well (e.g. Istio, longhorn, MongoDB, MySQL, Redis etc), we can leverage 3rd party dashboards to monitor their performance. Using the Grafana operator, it was possible for us to reference both kinds of dashboards in a consistent way.
3rd party dashboards are generally hosted on grafana.com. They can be referenced using dashboardId and revision. On the other hand, custom dashboards can be hosted on a github repo and referenced using an http URL. Despite coming from different sources, both kinds of dashboards can be referenced in a similar fashion. This approach also takes away the need to store raw dashboard definitions in JSON along with Grafana installation. This decouples the dashboard definition from the installation process.
Gotcha
One important thing to keep in mind is that Bitnami charts deploy Loki in distributed mode. This makes filesystem-based storage unsuitable for use and one needs to set up an object store (such as S3, GCS or MinIO) for proper operations.